Let’s Talk About Memory
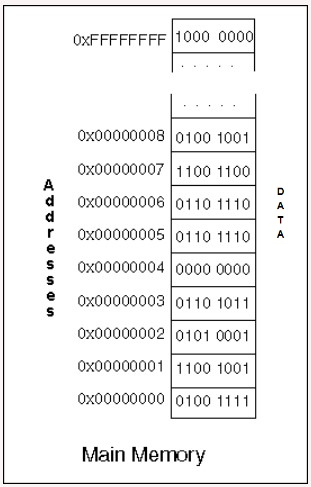
As Mano puts it in his book Computer System Architecture, the memory unit is an essential component of any digital computer to store programs and data. In modern systems, the processor communicates directly with the main memory which stores the executable code and data needed by the currently executing processes.
With the increase of data-intensive workloads, the main memory, however, is unable to store the code and the data all at once. The comparatively slower auxiliary memory in the system takes care of the long-term storage and is responsible for accommodating system programs, large data files, and indices.
The memory management unit of a system is responsible for
- Allocating memory to a process
- Cleaning up when it ends
- Handling situations where you might have to load data or code in parts to the main memory.
This is where the magic takes place and we will talk more about its behavior in this blog.
What is Virtual Memory?
When you talk about memory in modern systems, the amount of data and instructions on the main memory may not be enough to accommodate running programs.
The system expands the memory or technically the “address space” superficially into memory pages (i.e., chunks of logical address spaces) that can be loaded onto the main memory as a frame - a physical entity - when the contents on that page are needed.
The memory management unit handles the mapping of memory addresses between address spaces. These pages are then conveniently stored on the auxiliary memory units like solid-state drives and hard disk drives for instance, and swapped with the current page.
This allows a process that might need large data files or code that cannot be stored on the main memory unit at one time, to still get access to the same on the logical address space.
This concept is called paging and paging gives the system access to a larger virtual memory even though the amount of physical memory could be less.
Leaking Bytes
Consider an application that runs in the background continuously, like a server, that might allocate memory for a bunch of variables every time a client makes a request.
The memory management unit will try to allocate the requested memory from the virtual address space when requested.
From then on, the program will be able to access the virtual memory, however, the section of the memory that was allocated will be mapped to the physical main memory only when you try to access it afterwards.
In the long run, the memory management unit will have to allocate more pages of memory and eventually run out of virtual memory to allocate from and incur a large overhead to try and mitigate the situation.
This will set off a whole range of alarms across processes that might be running simultaneously. Usually, this might occur if the program is written in a language without garbage collection, which might have released the memory after the request was dealt with. With lower-level languages such as C, the developer is responsible for all such housekeeping tasks.
A solution to such a problem would be for the developer to debug the application by setting a host of breakpoints and observing the application’s memory footprint. Most programming languages come with tooling including debuggers which help a developer to carry out this task and ensure that they give back what they acquire.
In this blog, you will learn about
- Virtual memory management in C programs
- How the Linux kernel allocates memory to processes, handles situations where the requested amount of resources cannot be allocated
- And what patterns in programming can result in such scenarios.

By the end of this read, you will be familiar with all the concepts through hands-on and challenging tasks.
The code used in the activities can be found in the companion repository on GitHub.
Prerequisites
You will need access to a Linux system with root privileges to complete certain activities in this blog.
Blog Bonus: Get Cheat Sheet with 100+ Linux Commands [Free Resource]
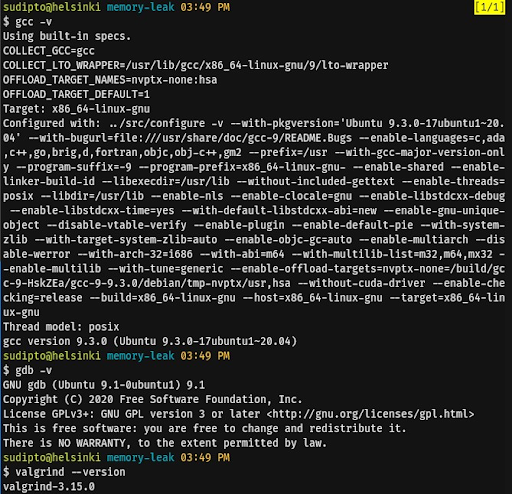
You will need the GNU Compiler Collection which contains the standard compiler to compile C programs, the GNU Debugger to debug the programs that you need to complete or run, and Valgrind which is a popular tool used to debug and detect memory leaks.
Install the required tools (and optionally the manual pages) by executing the following commands in a terminal:
sudo apt update
sudo apt install -y build-essential gdb valgrind
sudo apt install manpages manpages-dev manpages-posix manpages-posix-dev
Make sure the tools are installed correctly by running the following commands and checking if the output is similar to the following:
You need to have a high-level understanding of how basic C programs are written, compiled, and executed on Linux.
Also read: Learn 20 Basic Linux Commands with Simple Examples
Activity 1: Allocate Memory to a Program
When a program is in execution, it is known as a process. A process has to contain information such as the address of variables, the address space it is allowed to access, and a stack to save the return addresses and local variables as the program continues its execution. Each process is also assigned a heap which is the address space that can be used to dynamically allocate memory to a process.
In the logical address space, a process can be viewed as follows:
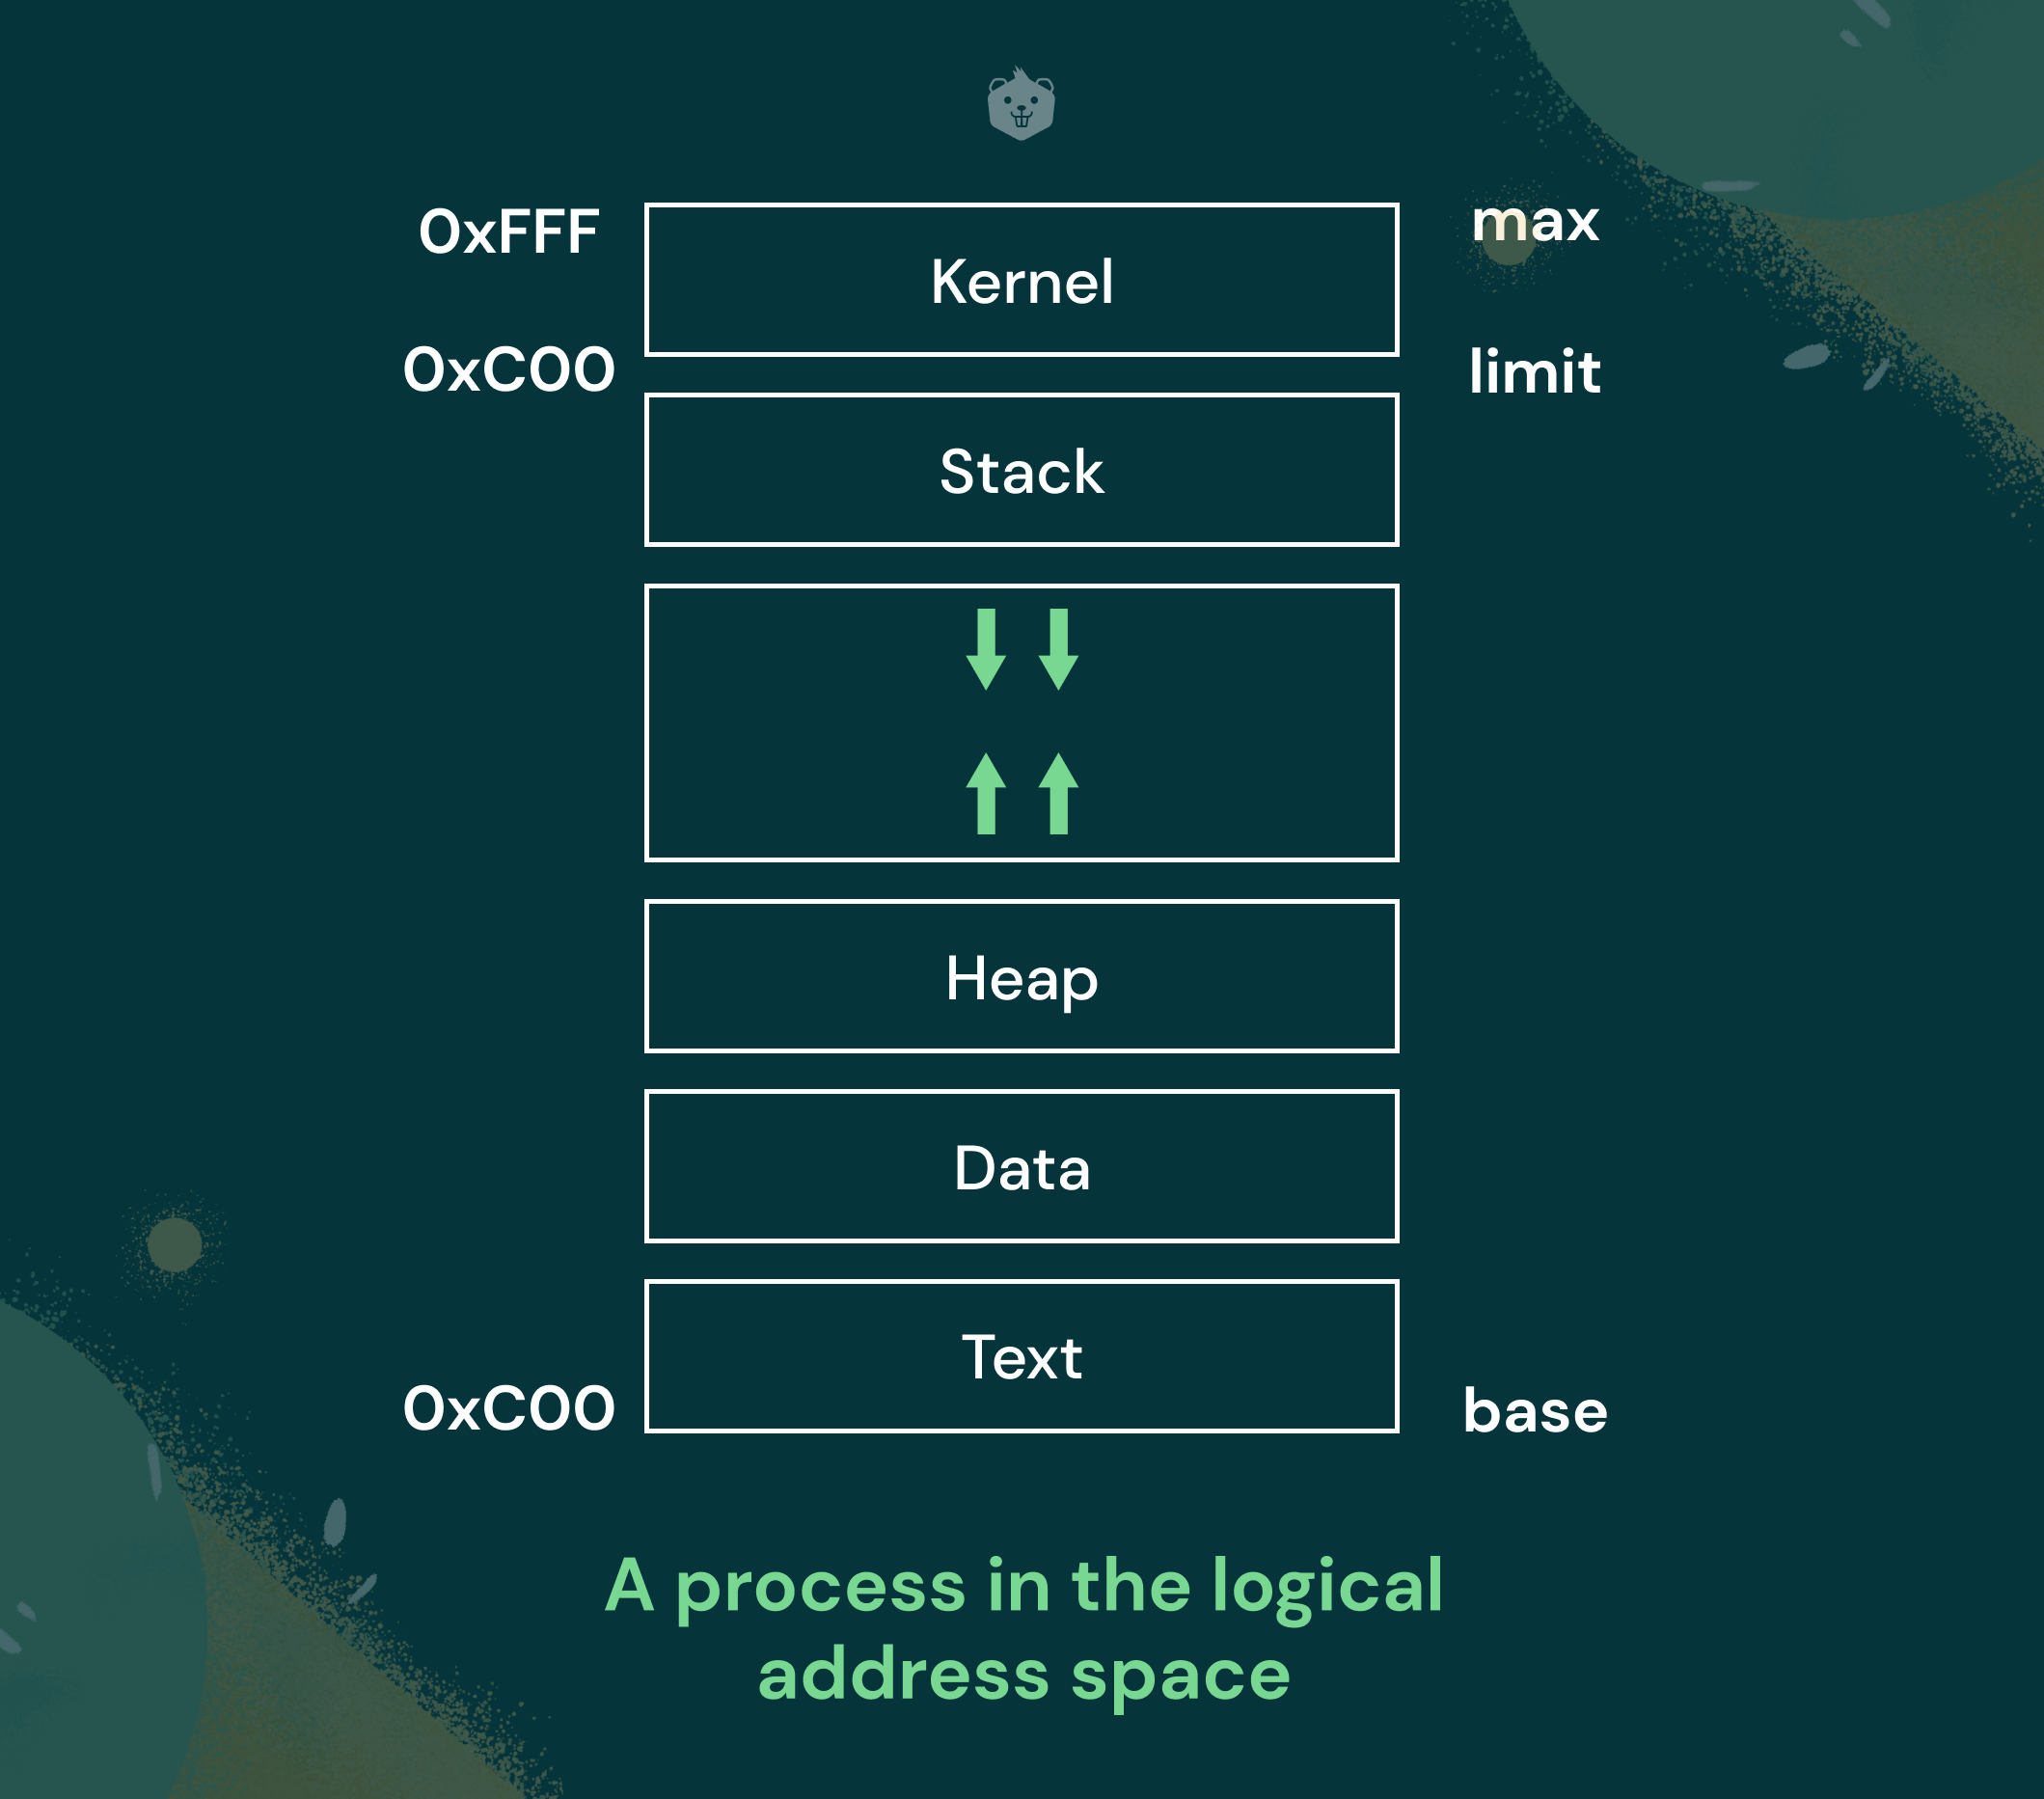
You can allocate memory (in bytes) from the process heap by calling malloc present in the standard C library. Read the manual page for malloc and determine what arguments have to be supplied and what will be the possible return value of a malloc call.

Allocate memory sufficient to accommodate an integer, from the process heap, a finite number of times by calling malloc and assigning the new address to a pointer.
Hint: To compile and execute the program, run g++ src/activity-1/activity-1.c && ./a.out in the terminal.
// src/activity-1/activity-1.c
#include <stdio.h>
#include <stdlib.h>

int main(void)
{
  int *t = NULL;

  // TODO: print the addresses returned
  // by malloc each time
  t = (int *)(malloc(sizeof(int)));
  t = (int *)(malloc(sizeof(int)));
  t = (int *)(malloc(sizeof(int)));
  t = (int *)(malloc(sizeof(int)));
  t = (int *)(malloc(sizeof(int)));

  return 0;
}
Challenge yourself
Determine the direction in which the heap grows by printing and comparing the values of the addresses returned on a successful memory allocation - observe whether the addresses are increasing or decreasing across allocations.
Hint: The %p format specifier can be used to print pointer addresses to the console.
Activity 2: Debug Unwanted Memory Leaks
Whenever malloc is called, it starts looking for a free memory block that fits the size for your request. In case the request can be satisfied, malloc returns the starting address of the reserved block, or NULL in case not enough memory is available. Scanning the memory for free blocks is an overhead and this is the reason local variables and memory that is allocated statically is stored in the stack and not in the heap.
When you allocate a chunk of memory but the process ends without deallocating that memory to eventually return it to the operating system, you essentially create a 'hole' and the operating system has to take care of this 'hole' when it needs to allocate memory to another process.
Compile the program in Activity 1 and pass the executable to Valgrind. Observe the output that Valgrind returns.
Compile the program again with the -g flag to include debugging symbols in the binary. Run Valgrind again, but this time with the --leak-check=full flag. Observe the output.

Pay attention to the heap usage and the leak summary in both of the cases. Note that Valgrind points you to the line numbers in the file that may be causing the memory leak if run with the --leak-check=full flag.
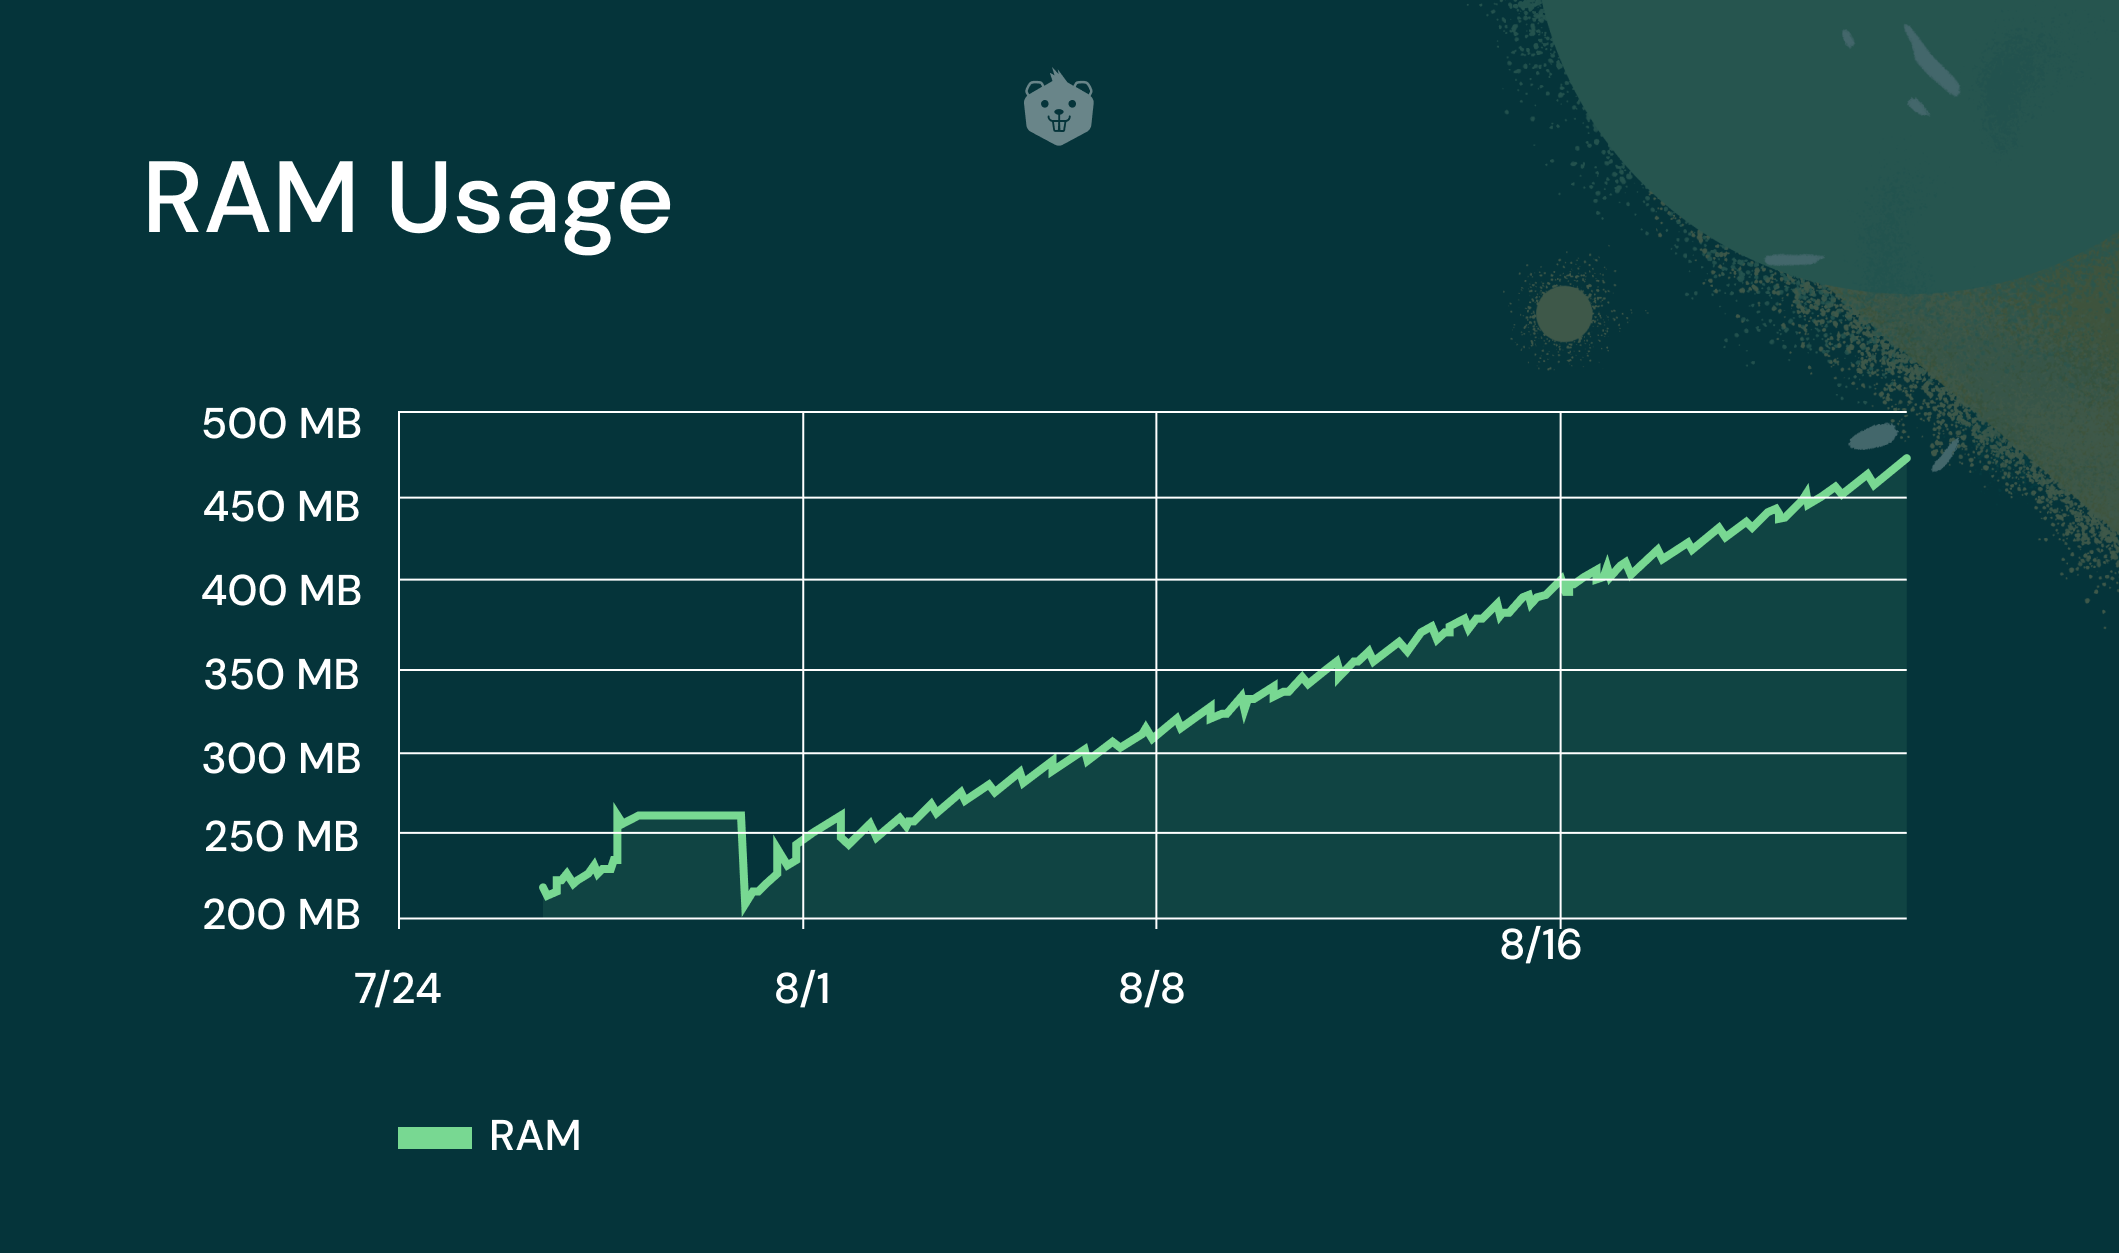
As the process keeps on requesting memory again and again after regular intervals without returning unused memory, it results in a memory leak. Consider the situation when a program has to run continuously for extended periods, like a year, for instance. The operating system will eventually run out of free memory resulting in an out-of-memory trap that has to be handled in some way. In the next couple of activities, you will learn more about the steps the operating system can take to handle this issue.
Challenge yourself
Confirm whether the line numbers reported by Valgrind correspond to the malloc calls in the program. Try adding a call to free() after a malloc call. Do you observe any difference in the number of leaks reported? Later in this article, we will take a look at how we can take care of the memory leaks.
Activity 3: Observe How Linux Handles OOM Traps
When you dynamically allocate memory, the heap expands if enough memory is available. What if the operating system runs out of free memory altogether? Note that this case is different from malloc not being able to allocate memory of a certain size, smaller chunks can still be allocated in those cases.
Study the code and observe the output (by printing the address returned by malloc) as you repeatedly allocate (or try to allocate) memory from the heap.
// src/activity-3/activity-3.c
#include <stdio.h>
#include <stdlib.h>

int main(void)
{
  int *t = NULL;

  while (1)
  {
    // TODO: print the address returned
    // by malloc every 2 seconds
    t = (int *)(malloc(sizeof(int)));
  }

  return 0;
}
Observe that the process gets 'killed' by the operating system after a while. Check the system log in /var/log/syslog if a diagnostic message was written to the logs. Use grep to find the messages relevant to the process (You may need root privileges).
Challenge yourself
Modify the program to iteratively allocate a total of 1 GB worth of memory to the same pointer. Observe whether eventually the process gets killed or malloc returns NULL by changing the size of requested allocation (in bytes) and playing around with how the iteration takes place. Read the system log to confirm the case if the process was killed.
Activity 4: Tame the Almighty OOM Killer
Had you noticed the messages in the logs when the program was killed in Activity 3? The kernel killed the process and the oom_reaper reclaimed the memory allocated to that process.
kernel: Out of memory: Killed process <process-id> total-vm:2012904kB ...
kernel: oom_reaper: reaped process <process-id> ...
Linux gives a badness score to each running process (oom_score) which shows how likely it is to be terminated in case the system runs out of memory. The system would try to kill off the minimum number of processes, ideally one, based on the score in order to resolve the situation. The oom_score of a process can be found in the /proc file system under the folder corresponding to the process ID of the particular process.
Modify the given program to allocate 100 MB worth of memory every 2 seconds. Run the program.
// src/activity-4/activity-4.c
#include <stdio.h>
#include <stdlib.h>
#include <unistd.h>

int main(void)
{
  int *t = NULL;

  printf("Process ID: %d\n", getpid());

  while (1)
  {
    // TODO: allocate 100 MB memory every
    // 2 seconds
    t = (int *)(malloc(sizeof(int)));
    printf("%p\n", t);
    sleep(1);
  }

  return 0;
}
Change the oom_score of a process manually by writing a large positive value to the oom_score_adj file in /proc/<pid>/oom_score_adj. Note the value of oom_score for the process before and after writing the value to oom_score_adj.
Whenever the operating system encounters an out-of-memory situation, it chooses the process with the highest oom_score, terminates it and the oom_reaper reclaims the memory. You can also call the OOM killer manually by writing f to /proc/sysrq-trigger (You need to be root). Check the logs if the process was killed.
The practical solution to avoid the OOM killer from killing your processes is to optimize the memory management in your programs or add more physical memory to the system.
Challenge yourself
Find out, from the Linux kernel documentation, how you can bypass the OOM killer from killing a process by setting a special oom_score.
Hint: The kernel processes are never killed!
Activity 5: Reclaim Sanity with free()
When you no longer need a block of memory, it can be deallocated and given back to the memory manager by calling free on the pointer to the starting of the block of the memory to be deallocated.
Observe that the pointer for the first pointer does not get altered even after calling malloc in the subsequent iterations while the second pointer gets altered. Think about it.
#include <stdio.h>
#include <stdlib.h>
#include <unistd.h>

int main(void)
{
  int *i = NULL;
  unsigned long *t = NULL;

  printf("Process ID: %d\n", getpid());

  while (1)
  {
    // TODO: resolve all the memory leaks
    i = (int *)(malloc(5e6 * sizeof(int)));
    printf("%p\t", i);
    free(i);
    t = (unsigned long *)(malloc(5e6 * sizeof(unsigned long)));
    printf("%p\n", t);
    sleep(2);
  }

  return 0;
}
It is important to note that a call to free() does not guarantee that the memory will be returned to the operating system. However, it does guarantee that a subsequent malloc will be able to claim the freed memory.
Challenge yourself
Resolve all the possible memory leaks in the program corresponding to this activity. Use Valgrind to confirm that all blocks of memory that had been allocated dynamically have been freed.
Summary
You are now better aware of the merits of good memory management and the possible consequences of memory leaks. You are also able to debug and fix easy-to-fix memory leaks in C programs. The code used in the activities in this article can be found in the companion repository.
Hope you enjoyed fun activities and challenging yourself to learn more about virtual memory.
Further Learning
If you found this interesting and want to explore more about Virtual Memory, take Crio’s free byte and strengthen your understanding about Virtual Memory.